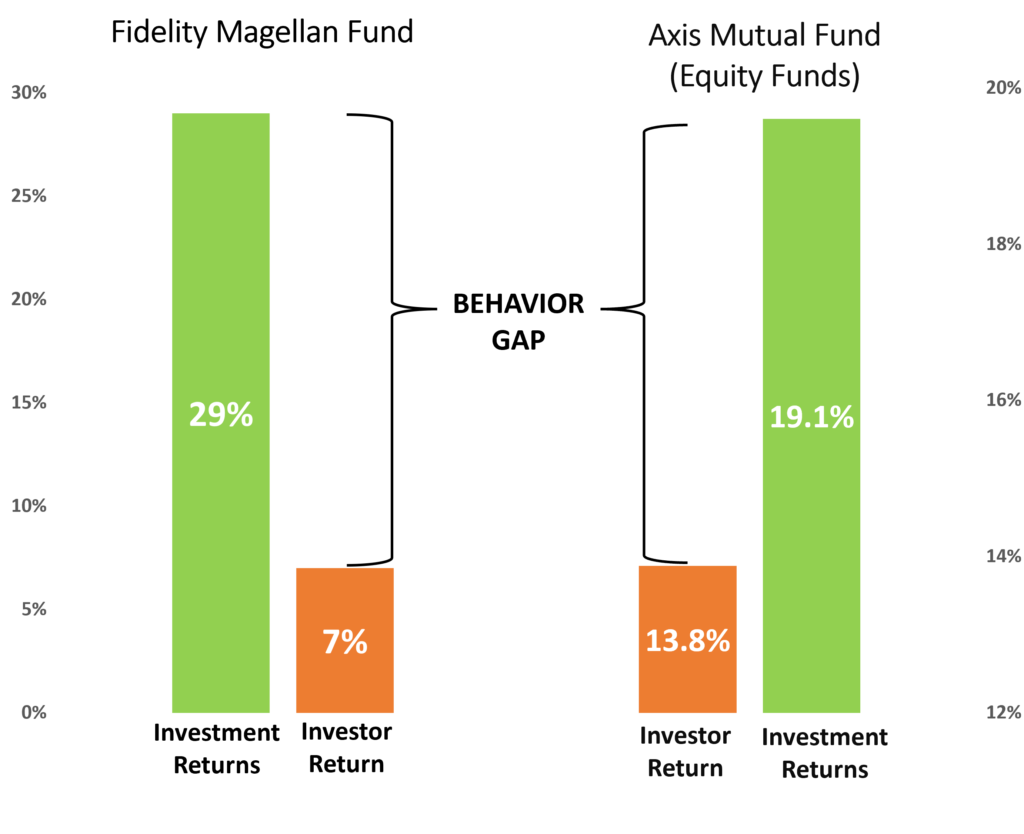
Even with the best fund, they have failed to create wealth, Investment Returns vs Investors Returns > Behavior Gap

Decoding Wealth Creation: Analysis on the Behaviour Gap in Investment Returns vs Investor Returns by Santosh Kedari CEO Sanriya Finvest Pvt Ltd.

Is wealth creation such a simple exercise? If so, we would have come across many successful investors. However, starting is simple, but sustaining it is tough, just like in relationships. 


All an investor wants is to get the Best Fund. But even the best fund failed to give returns to investors.

Peter Lynch, the famous fund manager, led the successful Fidelity Magellan Fund from 1977 to 1990. During that time, the fund achieved an incredible compound annual growth rate (CAGR) of 29%. However, investors in the fund only received 7% returns in the same period. In India, a 20-year study by Axis Mutual Fund (2003-2022) found that regular equity funds delivered a 19.1% CAGR, while investor returns were only 13.8% during this period.

What has caused the gap between fund and investor returns? Why does this happen?

It happens because of investors’ emotional and illogical behaviour, leading to unwise investment decisions, in a simple way doing dumb things with Investments, i.e., called a Behaviour Gap.

Common mistakes include:

  1. Investors trying to time the market,
  2. Overreacting to news,
  3. Chasing short-term performance, and
  4. Doing entry and exit at the wrong time or frequently, instead of being disciplined and sticking to their long-term plan.

It shows that investors are their own worst enemies when it comes to investing.

Lots of people wrongly think that investing is just about numbers, but in reality, it’s mostly about psychology. Unfortunately, this tends to lower long-term investment returns. It’s impossible to remove the certainty of uncertainty. Although we are aware that equity markets will fluctuate, the timing, duration, and magnitude remain uncertain.

Benjamin Graham’s wise words from his book, “The Intelligent Investor,” in 1929 still hold true today: “The Investor’s biggest enemy and worst problem is likely to be himself.”

In summary, successful wealth creation requires two things:

  1. Emotional discipline
  2. Consistent expert guidance.

To achieve long-term financial goals, it’s important to understand your emotions and avoid typical emotional mistakes. To address this, we formulate a financial roadmap, adhere to it, and bridge this gap.

Connect directly with Mr. Santosh Kedari on WhatsApp: Click here to message on WhatsApp.

Mr. Santosh Kedari CEO Sanriya Finvest Pvt.Ltd is a seasoned expert in the mutual fund arena and a Certified Financial Planner. He is committed towards bridging the Behaviour Gap in investments and offers tailored financial roadmaps for investors. For more information please visit, www.sanriya.net

Investment Returns vs Investors Returns > Behavioral Gap = Emotional and Illogical Investing Behavior with investments

#IntelligentInvesting #EmotionalFinance #WealthCreationWisdom #PsychologyOfInvesting #LongTermGrowth #InvestmentDiscipline #AvoidingInvestmentTraps #FinancialIntelligence #InvestingInsights #SmartInvestorMindset #bestfund #bestmutualfund #mutualfunds

Which is the better investment option: an FD, a flat, mutual funds, or gold?

“What People think about Real Estate?”

People would buy land / property / flat / real estate and sell or rent it for profit. Even after the banks and other investment avenues, most individuals still prefer to invest in property to earn a regular income and create wealth. You start earning rental income every month if you invest in a property and rent it out. After 10 or 15 years, the price would have increased when you sell the property, providing you a lump sum pay out. Today, loan accessibility and affordability have made owning property convenient for individuals. As a outcome, real estate is now an asset class for the masses, which used to be an asset class for the classes.

“What People think about Fixed Deposit?”

A bank mainly accepts deposits at a particular interest rate from its customers and provides loans at relatively higher rates to potential borrowers, earning them the margin. Bank does not invest its own money. It takes money from customers with fixed deposits and offers it to borrowers. Over time, fixed deposits became for many individuals a preferred investment choice as they were easy and the bank guaranteed returns. Fixed deposits provide you with the convenience of an assured return, but those yields are minimal and also generally fall below inflation rates.

Calculations for 2 situations are given in the table below where someone invests in a flat and a fixed deposit.
Many of us think that investing in real estate and property is a sure shot cash doubling method in which you can double your investment in a couple of years as demand for real estate is increasing more than ever before and individuals have a lot of disposable income. To find out which one is better, let’s do a small assessment. Investing the money in FD / RD or buying a property by taking a loan.
Few assumptions:
1] For investment purposes, a ready possession flat is brought on loan and will be sold at double the purchase price after 5 years.
2] ₹. 1 Cr Flat Cost. (₹ 20 Lakhs down payment and 80 Lakhs loan)
3] Flat given on rent. Every year, flat price and rent increased by 5%
4] The flat is sold at twice the price, i.e., after five years at ₹ 2 Cr.
5] Then compare the returns with another scenario where somebody invests the same amount as the down payment, the registration fee, the stamp duty amount in a fixed deposit and the EMI payments in a recurring deposit.
6] It shows that the post-tax returns at the end of five years demonstrate better yields from the second situation (of FD / RD).

WHEN A PROPERTY BOUGHT BY TAKING LOAN
ASSUMPTIONS
● Cost of Flat ₹ 1,00,00,000
● Down Payment (20% of Flat Cost) ₹ 20,00,000
● Loan Amount (80% of Flat Cost) ₹ 80,00,000
● Rate of Interest : 9%
● Expected monthly rental income (3% of flat value) ₹ 25,000
● Rent Increase Every Year by 5%
● Investor’s Tax Bracket 30%
● Sale Price of the flat (after 5 years) ₹ 2,00,00,000
OUTFLOW OF MONEY
● Upfront (Down Payment) ₹ 20,00,000
● Stamp Duty & Registration (Approx. at 6%) ₹ 6,00,000
● EMI @ 9% for 20 Years Loan ₹ 71,978
● Total EMI outflow over 5 years ₹ 43,18,685
● Principal Repaid 5 years ₹ 9,03,436
● Balance to repay ₹ 70,96,564
RETURNS ON FLAT / PROPERTY
WHEN MONEY IS INVESTED IN FD / RD
  If all the assumptions hold good, the amount of money one would have made from this real estate investment after 5 years, net of taxes, is as follows:   Instead of buying property, if the investor had kept the initial down payment & stamp duty amount of ₹ 26,00,000 in an FD @ interest Rate 8% and had opened a RD for the EMI of ₹ 71,978 for 60 months @ 7.2%, the amount that would have accumulated:  
A ● Gross inflow ( Sale of flat) ₹ 2,00,00,000 A ● Initial amount ₹ 26,00,000  
B ● Upfront Payment & stamp duty ₹ 26,00,000 B ● Interest earned on initial amount @ 8% p.a. ₹ 12,20,253  
C ● Rental Income (60 Months) (with 5% annual increase in rental) ₹ 16,57,689 C ● RD principal in 5 years on EMI of ₹. 71,978p.m. ₹ 43,18,685  
D ● Tax on rental income (after all deductions) ₹ 3,31,538 D ● RD Interest earned on EMIs in 5 years @ 7.2% p.a. ₹ 8,92,278  
E ● Capital Gain Tax @ 20% (assumed indexation of past 5 years) ₹ 8,12,248 E ● Tax on interest income @30% ₹ 6,33,759  
F ● Repayment of principal ₹ 70,96,564   ● Net inflow after 5 years  [a+b+c+d-e] ₹ 83,97,456  
G ● EMI Paid in 60 of months ₹ 43,18,685   The difference in cash flow between the FD / RD investment and the leveraging of real estate investment is nearly ₹ 15,98,801
 
     ○ Principal ₹ 9,03,436    
     ○ Interest ₹ 34,15,249    
H ● Tax saving on Interest Paid (Max Rs. 2 Lakh deduction on let out property) @ 30% ₹ 3,00,000
  The investment in FDs and RDs is tax inefficient and conservative. The total money inflow will definitely improve significantly if we plug in greater yields or tax-efficient returns. Builders and housing finance companies are the only members who would make money rather than you.
 
  The inflow after 5 years.   (a-b+c-d-e-f-g+h) ₹ 67,98,655
   
 So we can obviously see in purely financial terms that investing in FDs / RDs gives nearly ₹. 16 Lakhs higher returns than property. (Average diversified MFs returns for same periods are 12% CAGR. )

Which is the best investment to make in the long term? Property, fixed deposit, Stocks (equity) or direct equity through mutual funds?

Short reply: Equity (through Mutual Funds or directly stocks if you are expert). “I got wealthy by investing in FDs and by buying insurance policies ,”– no one ever said.

Long reply? Read on. 

What People think about Equity Mutual Fund (Stock Market)?

Many of us have often thought we’d rather get ‘ lower but safer ‘ returns from FDs than higher but volatile returns from equity mutual funds. If we invest on this basis, two significant points will be overlooked. 1] Equity markets are less long-term volatile and return are much higher than FDs or even real estate (and equity mutual funds make investing in stock markets very easy for individuals). 2 ] The returns we receive from FDs do not add wealth because inflation is nullified.

Investing in equity has generated an average annualized return of 16%. Short-term equity markets are certainly volatile (risky) – they have delivered +81% for one year and down -52% for another year, but they become less volatile over longer time horizons (and generate higher returns).

Equity returns are always over and above the inflation rate, i.e. 7.85% annualized over the past 40 years on average. Unfortunately, when we look at returns on our investments, inflation is a truth that we do not consider. We look at isolated returns and they often seem better than they really are worth. The lowest is fixed deposits (FDs) that are only 6.5% to 8% pa (but without volatility).

Basically real estate delivers only about 5 to 7% returns. (otherwise the Ambani’s, Tata’s, Birla’s, India’s Kotak’s of India would have had all their money in real estate rather than invested in businesses.)
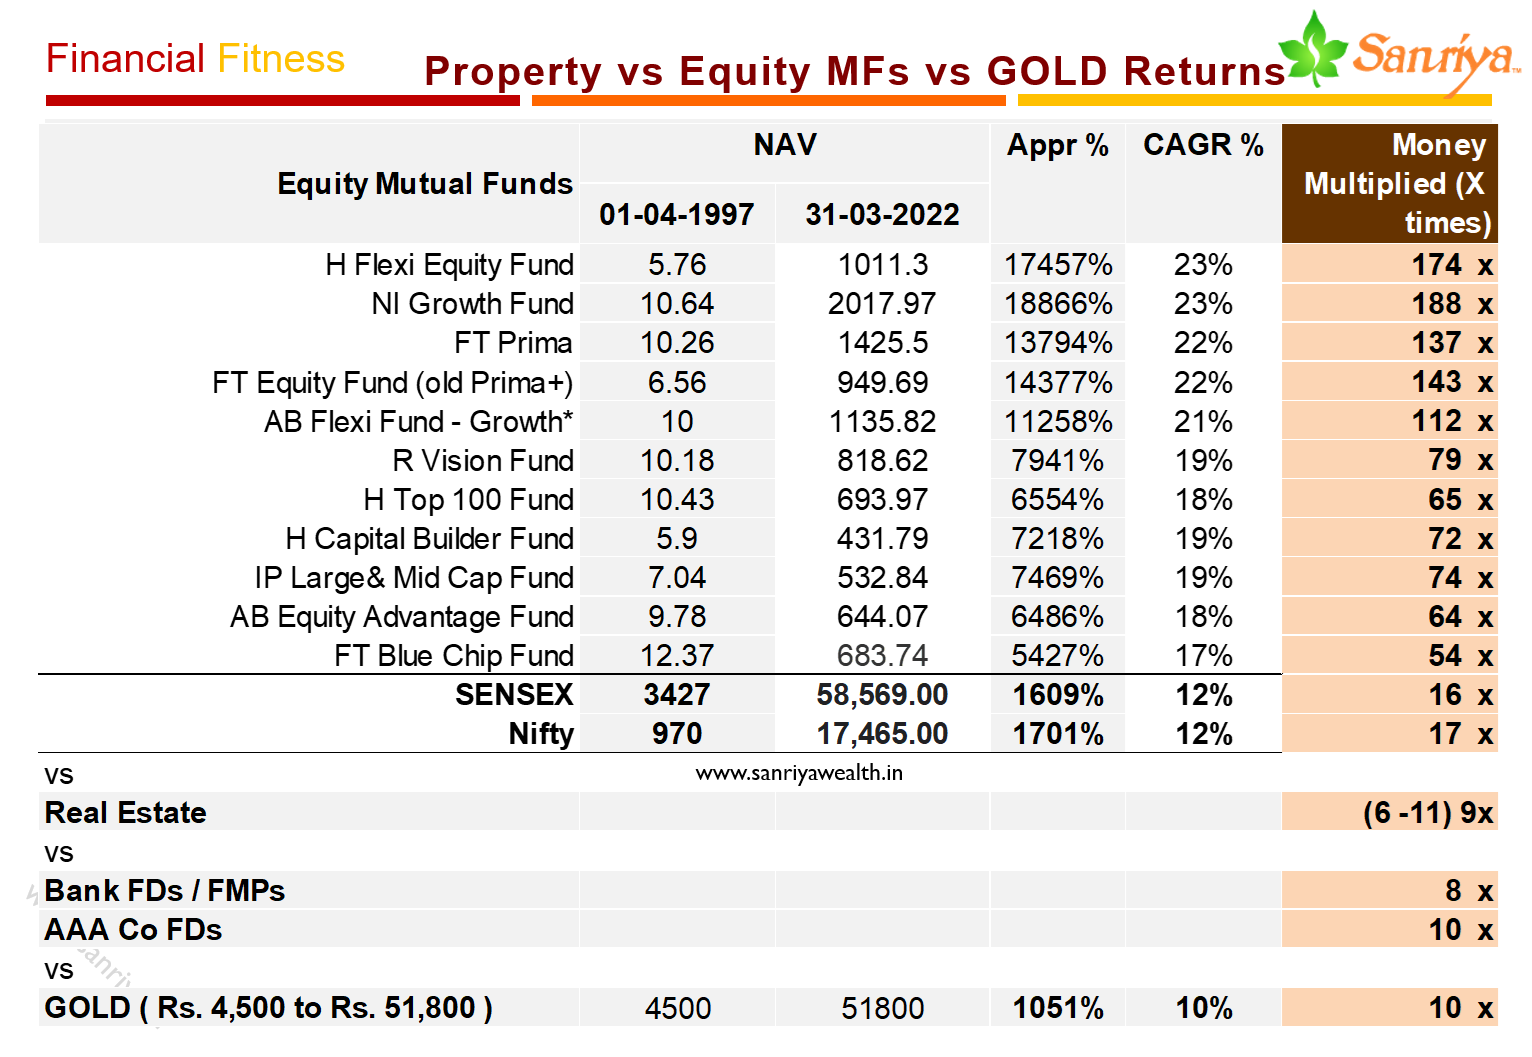
Investing in mutual funds for wealth creation is a much better instrument. If long-term financial goals require you to play it safely despite minimal returns, then stick to debt mutual funds. However, if the creation of wealth is on your radar, it is necessary to invest in equity mutual funds. One of the most common investment vehicles since time immemorial was fixed deposit, property, equity. They are very distinct, however, and meet distinct investor requirements, whether you are planning a short-term or long-term investment.

Your portfolio of investments should be a nice blend of investments in debt (FD type / fixed income / low risk) and equity (medium risk). Low-risk investments, however, generally provide stability and guaranteed returns. Investing in fixed deposits, property, mutual funds (equity) therefore has its own benefits and disadvantages. Therefore, before you begin looking at investment options, you must ensure that you work on your goals and financial plan.

Remember, as an investor, you need to spend some time evaluating your financial targets, risk preference, and time horizon. These three variables will assist you to determine the assets you can invest in and meet your goals. Talk to an investment advisor and take his help to creation of an investment plan. Your financial independence is dependent on how efficiently you create and implement your financial plan.

Reasons Not To Invest In Real Estate / Flat / Property:

There are few primary reasons why intelligent investors should avoid investing in flat / property:

 ♦ No Assured Returns: An unforeseeable property return (price). (The price will be decided by the buyer). Many individuals think there is always a increase in estate prices.
Price will skyrocket or fall just because of the place of the property, building quality, which makes the property an unexpected asset class. There may be downs on the estate market. In 1995, prices in Mumbai, Hyderabad, Delhi and other towns were corrected for up to 45% for 10 years. It depends on a number of factors. If the markets are declining, then you may have to wait a little longer.
An asset class under performance: most properties generate more or less the same returns over a period as Fixed Deposit.
Most of the illiquid assets are property. Real Estate is the market of a buyer when you need money as a matter of urgency and finding a buyer is not simple. Usually an urgent sale gets much less than the asset’s true value. Price is negotiated with a lot of legal hassle like vegetable.
It has hardly beat inflation
Offer an annual rent between 2% to 3% of the total value of property – less than the returns on an FD and less than the EMI payments.
 100% Occupancy is not ensured (by landlord).
Investors who blindly believe in real estate tend to recognize only windfall gains stories
Real Estate is a category of emotionally charged assets, as owners tend to connect properties to memories and feelings such as births, weddings, deaths, etc., which is why most investors forget about unnoticed return on investment.
Investors may face endless litigation for many reasons, such as family conflicts, tenant encroachment or anti-social aspects, a government entity seeking property for a public project, government record ambiguity, etc.
High maintenance efforts to maintain house in order. You have to pay taxes and utility bills, keep it in good condition, and also find fresh tenants when and when necessary. It needs time and energy at all times. Many people believe that investing in real estate is a lifelong expense.
Property performance monitoring has many challenges. In Mutual Funds, you can monitor their output on a regular basis by clicking a button. But if you own 5 properties, can you check them physically every day?
Alterations, Changes, value-addition does not produce returns, an investor may add equipment, interior decoration and gadgets to improve the experience of living in a property, but the next investor may want to customize the property differently and will therefore not be willing to compensate the seller for the additional investments made.
Buyers and sellers often can’t agree on even Vaastu
 Even for small issues with society or neighbors, you can’t change home anytime. You can’t change your home anytime you want to move to another town for better employment. Even if you want to manage the traffic from one location to another, you can not change home at any moment. You can’t change your home anytime, even if you need a family from 2 BHK to 3 BHK etc.
 You can not change your flat at any moment, even if your tax benefits decreases, (like the principal’s 80C and interest’s 24(b).) You can’t change home whenever a new cosmopolitan area comes in the town that’s better than where you’re staying now. If you move out of town, it’s a issue to find a tenant. A tenant who can turn your dream home into a dirty home, and so on.

Disclaimers: This subject is solely from a financial / investment point of perspective. We won’t take in any psychological or emotional elements. And ultimately it’s up to you to decide what’s better. Mutual funds and securities investments are subject to market risks and there is no assurance or guarantee that the objectives of the Scheme will be achieved. Past performance of the Sponsor/ Mutual Fund/ Investment Manager are not indicative of the future performance of the Scheme(s)

Fixed Deposits Vs. Real Estate Investment, Which Is The Best Investment Option – Stock Markets, Mutual Funds, Real Estate Or Fixed Deposits?, Real Estate Investing Vs Fixed Deposit, Big Reasons Not To Invest In Real Estate, Why Smart Investors Should Avoid Investing In Real Estate, REASONS WHY YOU SHOULD CHOOSE EQUITY OVER FD, GOLD & REAL ESTATE, Which Is The Best Investment Option? Mutual funds vs Stock Markets Vs Real Estate Vs Fixed Deposits, Which Is Better : Investing In Real Estate Or gold, Which Is Better : Investing In Real Estate Or fixed deposit, Which Is Better : Investing In Real Estate Or mutual funds, Which Is Better : Investing In Real Estate Or Fd, Fixed Deposit Vs Real Estate Based On Current Market, Investing In Property Vs Investing In Equity: Which Gives Higher Returns?, Which is the best long-term investment to make? Property, Fixed Deposit, Equity though Mutual Funds or direct stocks?, FIXED DEPOSIT vs Flat investment, FIXED DEPOSIT vs Property investment, FIXED DEPOSIT vs Real Estate, FIXED DEPOSIT vs Mutual Funds, FIXED DEPOSIT vs Stocks, Mutual funds Vs. Real Estate Investment, Which Is The Best Investment Option – Stock Markets, Mutual Funds, Real Estate Or Mutual funds?, Real Estate Investing Vs Mutual fund, Big Reasons Not To Invest In Real Estate, Why Smart Investors Should Avoid Investing In Real Estate, Reasons Why You Should Choose Equity Over Fd, Reasons Why You Should Choose Equity Over Fixed deposit, Gold & Real Estate, Which Is The Best Investment Option? Stock Markets Vs Real Estate Vs Mutual funds, Which Is Better : Investing In Real Estate Or Fixed deposit?, Mutual fund Vs Real Estate Based On Current Market, Investing In Property Vs Investing In Equity: Which Gives Higher Returns?, Which Is The Best Long-Term Investment To Make? Property, Mutual fund, Equity Though Mutual Funds Or Direct Stocks?, Mutual fund Vs Flat Investment, Mutual fund Vs Property Investment, Mutual fund Vs Real Estate, Mutual fund Vs Stocks investment, Buying a property by taking a loan Vs investing the money in FD/RD, Buying a flat by taking a loan Vs investing the money in FD/RD, Buying a home by taking a loan Vs investing the money in FD/RD, making fd is better than taking flat on loan, earn more on fd than taking flat on loan, earn more returns on fd than flat, earn more returns on fd than real estate, earn more returns on fd than property, making fixed deposit is better than taking flat on loan, earn more on fixed deposit than taking flat on loan, earn more returns on fixed deposit than flat, earn more returns on fixed deposit than real estate, earn more returns on fixed deposit than property,
The Reality of Wealth: Nobody Gets Rich by Salary Alone!

In today’s fast-paced world, depending only on a salary is no longer a guaranteed path to wealth. While a steady paycheck offers stability, it’s not designed to make you financially free. A recent study of the world’s wealthiest individuals shows a compelling pattern:
🔹 75% are Entrepreneurs
🔹 15% are Investors
🔹 7% are Athletes
🔹 3% are Artists
🔹 0% are Employees

Let that sink in: Almost no one gets rich from just a salary.

The Reality of Wealth

The Salary Trap: What’s Holding You Back?

A salary gives you comfort, but not freedom. Most employees work hard every month, only to see their income spent on rent, bills, and EMIs. Even if they save, inflation and taxes quietly erode their wealth over time.

💼 A job gives you money to live today.

💸 But wealth creation is about building for tomorrow.

The Moral: Think Beyond Your Paycheck.

Salary alone won’t make you rich – investing and creating multiple income streams will.

This is the golden rule followed by every wealthy individual. Your salary should be a tool, not your only financial strategy. The rich use their income to invest, build businesses, acquire assets, and multiply returns.

Real Wealth is Built Outside the Payslip

Let’s compare two mindsets:

🔹 Meera – Salary-Only Mindset:

Relies 100% on her job. Spends most of her income. Saves a little in a savings account. No additional income source.

🔹 Karan – Wealth-Building Mindset:

Uses his salary to invest in mutual funds, SIPs, real estate. Creates passive income. He continually learns and adapts new skills to grow his income.

After 20 years, Karan is financially independent. Meera is still working paycheck to paycheck.


One Income is Risky – Here’s Why You Need More

⚪Mutual Funds (SIP & Lumpsum) – Grow wealth with smart investing and compounding
⚪Fixed Deposits (FDs) – Provide stable, low-risk income through guaranteed interest
⚪Bonds – Generate steady returns with options for tax savings and capital protection
⚪Freelancing / Side Hustles – Turn your skills, hobbies, or expertise into extra income
⚪Real Estate – Build long-term wealth through rental income and property appreciation
⚪Stock Market – Participate in the growth of businesses and gain from capital appreciation

Even small investments or efforts today can lead to big results tomorrow.

The Game-Changer: Financial Education
Start learning how money works. Study personal finance, taxation, and investment vehicles. Understand risk and reward. Seek mentors or advisors who can guide your financial journey

💡 “Don’t just work for money. Make your money work for you.”

🔑 Key Takeaways

Key Takeaways

1. A salary provides stability, but rarely builds wealth

2. True financial growth requires investing and diversification

3. Multiple income streams are essential in today’s economy

4. Early and consistent investing leads to financial freedom

5. Educate yourself – money multiplies when managed wisely

Conclusion

If you’re serious about wealth, don’t stop at earning — start investing and creating. Break free from the “salary-only” mindset and take control of your financial future. For any further information or assistance, please feel free to contact us or email us at info@sanriya.net.

“Your salary is a tool. Use it wisely to build a life of freedom and abundance.”

📌 Disclaimer

The information provided here is for educational and illustrative purposes only and should not be considered financial, investment, or tax advice. Data shared is illustrative, based on public sources like Wealth-X, Credit Suisse, Statista, Forbes, HBR, CNBC. Please consult a qualified financial and tax advisor before making investment decisions.

Looking to deepen your knowledge? Explore our valuable resources for insights on benefits, strategies, and smart investment approaches. Learn how to make the most of your investments with expert tips and guidance. Stay informed and invest wisely!

1) SIP Investment: A Smart & Simple Way to Build Wealth
2) Systematic Transfer Plan (STP) in Mutual Funds – A Complete Guide
3) Systematic Withdrawal Plan (SWP) in Mutual Funds – A Complete Guide
4) The Power of Tax Deferment: Let Your Money Grow, Not Your Tax Burden!

Financial Freedom, Invest Smart, Multiple Income Streams, Salary Is Not Enough, Wealth Mindset, Money Matters, Smart Money Moves, Financial Planning, Passive Income, Grow Your Wealth

The Power of Tax Deferment: Let Your Money Grow, Not Your Tax Burden!

The Power of Tax Deferment: Let Your Money Grow, Not Your Tax Burden!

When you invest, how your gains are taxed can make a huge difference to your final wealth. Two common types of investments behave very differently when it comes to taxation:

Understanding the Tax Difference:

🔹 Taxed on Withdrawal Investments (e.g., certain mutual funds): – Your gains are taxed only when you withdraw, allowing the entire amount to grow uninterrupted.

🔹 Taxed Annually Investments (e.g., traditional fixed deposits): – Interest is taxed every year, even if you reinvest it, reducing your net return each year.

Over time, this seemingly small difference leads to a significant gap in the final corpus. Let’s break it down with a simple example:

Power of Tax Deferment

The Power of Tax-Efficient Growth: Ravi vs. Sameer

Both Ravi and Sameer invest ₹10,00,000 for 30 years, aiming for 15% annual returns.

Ravi chooses a Taxed-on Withdrawal Investment
Sameer chooses a Taxed Annually Investment
• Both fall under the same tax bracket, for e.g. 35% (including all taxes and surcharges)

🔹Ravi’s Tax-Efficient Journey:-

Since Ravi’s investment grows tax-deferred, his effective post-tax return is approx. 13.3% per year (assuming long-term capital gains tax applied only on maturity).
👉 After 30 years, Ravi ends up with ₹4.33 Crores (after tax).

🔹Sameer’s Tax-Draining Path:- 

Sameer pays tax on returns every year, which drags down his effective return to 9.75% annually.
👉 After 30 years, his investment grows to just ₹1.63 Crores (after tax).

The Big Difference

🔍 Even though both invested the same amount with similar gross returns, Ravi ends up with ₹2.7 Crores more — just by deferring his taxes. That’s the magic of tax deferral.

📊 Comparison Table:

Investment Type

Annual Return

Effective Post-Tax Return

Final Amount After 30 Years

Taxed on Withdrawal

15%

13.3%

₹4.33 Crores

Taxed Annually

15%

9.75%

₹1.63 Crores


📈 Year-wise Growth Snapshot:

Year

Taxed on Withdrawal (₹)

Taxed Annually (₹)

1

11,33,000

10,97,500

2

12,83,689

12,04,506

3

14,54,419

13,21,946

4

16,47,857

14,50,835

5

18,67,022

15,92,292

10

34,85,773

25,35,393

15

65,08,016

40,37,085

20

1,21,50,613

64,28,217

25

2,26,85,468

1,02,35,598

30

4,23,54,279

1,62,98,058

🔑Key Takeaways

1. Taxed on Withdrawal investments allow your wealth to grow faster by deferring tax until redemption.

2. Taxed Annually investments reduce growth potential due to yearly deductions.

3. Over long horizons, tax-efficient choices can significantly boost your final corpus.

4. Time and tax deferral are powerful allies in wealth creation.

Key Takeaways

💡Conclusion

Conclusion

As Charlie Munger said, “The first rule of compounding: never interrupt it unnecessarily.”
Choosing tax-efficient investment options is a smart long-term strategy. Don’t let yearly taxes erode your wealth potential. Let your money work harder — and smarter — for you.

Maximize Returns. Minimize Taxes. Choose Wisely

Disclaimer: The information provided here is for educational and illustrative purposes only and should not be considered financial or investment advice. Returns and tax assumptions are hypothetical. Actual performance will vary based on market conditions, investment products, and individual tax profiles. Please consult a qualified financial and tax advisor before making investment decisions.

Looking to deepen your knowledge? Explore our valuable resources for insights on benefits, strategies, and smart investment approaches. Learn how to make the most of your investments with expert tips and guidance. Stay informed and invest wisely!

1) How Does Tax Work for SIP, STP, and SWP?
2) What are the differences between ELSS, PPF, NSC, and Bank FDs regarding tax-saving benefits under Section 80C?
3) What are ELSS (Equity-Linked Savings Schemes) or tax-saving mutual funds?
4) What is the Taxation on Hybrid Funds?
5) How are Debt Fund Returns Taxed?
6) How Do Taxes Work on Equity Funds?
Tax Free Compounding, Mutual Funds Vs FD, Wealth Creation, Financial Freedom, Invest Wisely, Smart Investing, Long Term Growth, Power Of Compounding, Equity Mutual Funds, Passive Wealth, Tax Efficient Investing, Tax Deferred Growth, Wealth Creation, Long Term Investment, Smart Investing, Power Of Compounding, Financial Planning, Invest To Grow, Compounding Matters, Tax Saving Tips

The Basic Monthly Budget Planner (spending planer) – Expenses Tracker Worksheets Everyone Should Have…

A personal or household budget is an itemised list of expected income and expenses that helps you plan how you’ll spend or save your money as well as track your actual spending habits.

Tracking your expenses might be challenging, especially if you’ve put it off for a long time or have never done it before. But if you start looking at your budget and finances seriously, you’ll feel relieved and in charge. Getting control of your finances and loans pays off nicely: peace of mind and no more loans!

When it comes to keeping track of your expenditures, there are a variety of reasons to do so. Perhaps you want to know where your money goes, are working toward a specific goal, or want to get rid of your debt for good. Whatever your purpose, we have the tools and resources to assist you in getting started.

Keep track of your income and expenses with this monthly budget planner format. Choose from a list of comprehensive expense categories using a simple Excel spreadsheet, then personalise things by renaming any category to make tracking easier.

INCOME

Frequency Amount Monthly Yearly

Total Income (net)

214166.67 2570000.00
Salary/Wages Monthly 150000.00 150000.00 1800000.00
Salary/Wages (Spouse) Monthly 50000.00 50000.00 600000.00
Dividend Monthly 0.00 0.00 0.00
FD’s Interest Yearly 50000.00 4166.67 50000.00
Other Monthly 10000.00 10000.00 120000.00

SPENDING

152100.00 1825200.00
Transportation 29750.00 357000.00
Auto Loan/Lease Monthly 10000.00 10000.00 120000.00
Insurance/ Registration Yearly 20000.00 1666.67 20000.00
Gas/Petrol etc Monthly 5000.00 5000.00 60000.00
Maintenance / Tires Quarterly 5000.00 1666.67 20000.00
Toll / Parking / Driver Yearly 120000.00 10000.00 120000.00
Cab/Auto Exps Monthly 1000.00 1000.00 12000.00
Bus pass Monthly 0.00 0.00 0.00
Accessories Yearly 5000.00 416.67 5000.00
Home 47416.67 569000.00
EMI / Rent Monthly 25000.00 25000.00 300000.00
Groceries Monthly 10000.00 10000.00 120000.00
Repair / Maintenance Monthly 1000.00 1000.00 12000.00
Home Insurance Yearly 0.00 0.00 0.00
Furniture Yearly 5000.00 416.67 5000.00
Household Supplies Monthly 3000.00 3000.00 36000.00
Alcohol / Beverages Monthly 1000.00 1000.00 12000.00
Property Tax Yearly 12000.00 1000.00 12000.00
Domestic Staff Monthly 5000.00 5000.00 60000.00
Other Monthly 1000.00 1000.00 12000.00
Utilities 7433.33 89200.00
Phone – Home /Cell Monthly 1000.00 1000.00 12000.00
New Mobiles Yearly 10000.00 833.33 10000.00
Cable TV Monthly 400.00 400.00 4800.00
Gas Monthly 900.00 900.00 10800.00
Water Monthly 500.00 500.00 6000.00
Electricity Monthly 1200.00 1200.00 14400.00
Internet Monthly 600.00 600.00 7200.00
Parlors Men -Women Monthly 2000.00 2000.00 24000.00
Other Monthly 0.00 0.00 0.00
Health 5083.33 61000.00
Dental Yearly 15000.00 1250.00 15000.00
Medical Monthly 0.00 0.00 0.00
Medication Monthly 500.00 500.00 6000.00
Vision/contacts Semi-Annually 5000.00 833.33 10000.00
Life Insurance Yearly 15000.00 1250.00 15000.00
Medical Insurance Yearly 15000.00 1250.00 15000.00
Other Monthly 0.00 0.00 0.00
Entertainment 22833.33 274000.00
Memberships clubs, society Yearly 5000.00 416.67 5000.00
Dining out / Birthday Party etc Monthly 4000.00 4000.00 48000.00
Events / Gifts Yearly 5000.00 416.67 5000.00
Subscriptions Gyms/Magazine Monthly 500.00 500.00 6000.00
Family Functions Monthly 2000.00 2000.00 24000.00
Music / Movie Monthly 500.00 500.00 6000.00
Hobbies Weekly 2000.00 8666.67 104000.00
Travel/ Vacation Yearly 50000.00 4166.67 50000.00
Festival Exps Diwali, Ganpati Yearly 20000.00 1666.67 20000.00
Other – Monthly 500.00 500.00 6000.00
Miscellaneous 39583.33 475000.00
Dry Cleaning Monthly 500.00 500.00 6000.00
New Clothes / Shoes Yearly 25000.00 2083.33 25000.00
Donations/Charity/Ganpati Yearly 1000.00 83.33 1000.00
Child Care / Tuitions / Fees Monthly 12000.00 12000.00 144000.00
Parents Exps Monthly 10000.00 10000.00 120000.00
College Loans Monthly 0.00 0.00 0.00
Pocket Money Weekly 500.00 2166.67 26000.00
Weddings, Birthdays, Christmas, Diwali New Year etc
Bonus to Domestic Staff
Yearly 5000.00 416.67 5000.00
Cosmetics Monthly 2000.00 2000.00 24000.00
Tax Yearly 100000.00 8333.33 100000.00
Pets Exps Monthly 2000.00 2000.00 24000.00
Other Monthly 0.00 0.00 0.00

Expense Categories – Know Where Your Money is Going

Housing: mortgage, rent,  house insurance, property taxes

Utilities: phone/cell, cable/internet, gas, security

Household:  water tank, roof and redevelopment, decor, upgrades, storage locker, gardening, cleaning services, outdoor equipment and maintenance

Groceries: food, baby needs, household supplies, toiletries

Living: personal care, bank fees, salon and spa services, dry cleaning, pet costs, memberships (fitness, clubs, associations)

Transportation: fuel, auto insurance, transit, parking, taxi, rentals, car sharing, tolls

Health Care: medical premiums, life insurance, medication, eye care, dental, supplements, wellness costs

Personal: tobacco, alcohol, books, music, clothing and shoes, donations, subscriptions

Eating Out: meals, snacks, take-out, beverages (coffee, tea, juice, soft drinks)

Entertainment: recreation, sports equipment and fees, movies, concerts, hobbies, gaming

Child: daycare, lessons and activities, allowance, school supplies and fees, babysitting, programs, tutors

Debt Payments: credit cards, loans, leases, support payments, government debts, personal debt

Savings: emergency fund, seasonal expenses (e.g. car repairs or maintenance, travel – vacations or staycations, gifts for birthdays or holidays, assisting family or friends)

Business Expenses: materials, labour, taxes, professional or administrative fees, human resources, uniforms or clothing


Jobs: Jr & Senior Operations Executive–Back Office

Job Title:  Jr & Senior Operations Executive–Back Office.

No of Vacancies: 2

Job City: Pune

Company Profile : Sanriya Finvest Pvt. Ltd is among the leading mutual fund distributors in India and servicing its client base spread across India and the globe. For more information about the company visit: http://www.sanriya.net/

Desired Candidate Profile :

  • Candidates having 1-5 years of work experience with Mutual Distributor / RIA Operations / related to financial industry will be given preference.
  • Graduate (50%+marks), B.Com Preferred, NISM V-A certifications would be an added advantage.
  • Opportunity for Pune-based candidates only.
  • Good command over written & spoken English is essential.
  • Knowledge with MS Office Word / Excel operations.
  • Handling Mutual Funds transactions on online platforms is a plus (NSENMF, BSEStarMF, MFU, etc).

Roles and Responsibilities :

  • Managing the Mutual Fund Distributor’s back-office activities, including handling documents for investment products such as mutual funds and other financial products
  • Data management for the portfolio, as well as daily database maintenance.
  • Client servicing and implementation requests are managed according to agreed-upon TATs.
  • Client servicing data and software management and upkeep.
  • Managing daily back-office operations in accordance with established systems and procedures.
  • Coordinating with team members for documentation and client servicing management.
  • Sending emails well-drafted in English within the strict turnaround times.
  • Reporting Sending of portfolio reports/tax reports / any other reports report generation and sending and General office administration
  • To ensure investment plan execution with 100% accuracy and zero error.
  • Managing and Maintaining integrity of the database, data back-ups.

Salary Range : Rs. 1,80,000 to 3,60,000 p.a. depending on experience and skills.

Contact No : 9552537696 / 25 Email: spk@sanriya.net

What does a Consolidated Account Statement (CAS) mean?

A Consolidated Account Statement (CAS) is a comprehensive report that brings together all your mutual fund transactions and holdings into a single document. Whether you’re investing for retirement, your child’s education, or planning an emergency fund, the CAS offers a complete picture of your portfolio, making it easier to track and manage your investments across various fund houses and securities.

Issued by the 10th of every month, the CAS details all your transactions—such as purchases, redemptions, and switches—along with distributor fees and the closing value of your investments. If you’ve registered your email ID, the CAS will be delivered electronically; otherwise, it will be sent to your registered address. You can also conveniently download it from platforms like CAMS and KFintech (Karvy).

For anyone seeking goal-based investing or wondering how to start goal-based investing in India, the CAS acts like a monthly report card, helping you stay organized and make informed decisions. It supports better budgeting and financial planning, essential for setting up strategies like a vacation savings plan or investment planning for a home purchase.

Whether you’re working with a certified financial planner, a wealth management consultant, or looking for a financial advisor in Pune, this statement is a vital tool. As a trusted mutual fund distributor in India, we recommend reviewing your CAS regularly to optimize your investment strategies for wealth creation and ensure your portfolio stays aligned with your financial goals.

To access your CAS, simply visit the CAMS or Karvy website, log in, and download the statement—it’s a small step that makes a big difference in your financial journey.

A Consolidated Account Statement (CAS) offers a unified view of your mutual fund investments. With guidance from a mutual fund distributor, investors can align their CAS insights with goal-based investing — from child education investment plans and retirement planning to emergency fund planning and vacation savings plans. A trusted mutual fund advisor in India or certified financial planner can help structure your wealth creation strategies with personalized financial planning services.


What is the cut-off timing for mutual funds?

The new rule regarding the applicable Net Asset Value (NAV) for mutual fund transactions, which occurred on February 1, 2021, requires that the NAV for all purchase transactions be determined based on the realization of funds. This rule was already in place for liquid and overnight funds and has now been extended to all mutual fund schemes. The key change is that the funds must be available in the mutual fund’s bank account before the cut-off time for the NAV to be applicable for that business day.

The value of a mutual fund, known as its Net Asset Value (NAV), changes daily. The NAV at which you buy or sell mutual fund units depends on when you submit your transaction. This is determined by the cut-off time and the deadline for submitting your investment or redemption request.

Type of Scheme Transaction Type Cut-off Time Applicable NAV
Liquid Funds
&
Overnight Funds
Subscription
(including Switch-in)
1:30 p.m. NAV of the same day if funds
are available before cut-off;
otherwise, the next business day’s NAV.
Redemption
(including Switch-out)
3:00 p.m. NAV of the same day if received
before cut-off; otherwise,
the next business day’s NAV.
Other
Mutual Funds (Equity/Debt, etc.)
Subscription
(including Switch-in)
3:00 p.m. NAV of the same day if funds
are available before 3:00 p.m.
If not, NAV of next business day.
Redemption
(including Switch-out)
3:00 p.m. NAV of the same day if received
before cut-off, otherwise next
business day’s NAV.
Inter-scheme Switching Switch-out Before
3:00 p.m.
Same Business Day NAV for
Switch-out transactions.
Switch-in After
3:00 p.m.
NAV of the Business Day on which
the funds are received in the
“Switch-in” scheme before 3:00 p.m.
SIP
Transactions
SIP Installment Before
3:00 p.m.
NAV of the same business day if
funds are received before cut-off time.
Otherwise, NAV of the next business day.
Reinvestment of Dividends Reinvestment of Dividends N/A NAV will be at ex-dividend NAV.
NFO
(New Fund Offers)
Purchase &
Switch-in
Before close
of NFO date
Units allotted at the closing date’s NAV, only
if funds are credited before the allotment.

Key Points:

  • Cut-off time refers to the specific deadline for transactions to be processed for the same day’s NAV.
  • NAV (Net Asset Value) determines the value of your mutual fund units. If the transaction is completed before the cut-off time, the NAV of that day applies. If it’s after the cut-off, the next business day’s NAV applies.
  • For SIP or lump sum transactions, if the funds are received after the cut-off, the NAV of the next business day will apply.

Examples

  • Lump Sum Purchase: If a ₹50,000 transaction is made on Thursday, February 11, 2021, before the cut-off time of 3:00 p.m., but the funds arrive after the cut-off time, the NAV for Friday, February 12, 2021, will be applicable. If funds arrive after 3:00 p.m. on Friday, the NAV for Monday, February 15, 2021 (due to the weekend) will apply.
  • SIP Transactions: If an SIP payment is scheduled for the 10th of each month, the NAV for that date is applicable only if the funds are credited to the mutual fund’s account before 3:00 p.m. on the 10th. Otherwise, the NAV for the next business day will be applied.

Inter-Scheme Switching

For inter-scheme switches:

  • Switch-out transactions: Treated as redemptions and processed at the same day’s NAV if received before the cut-off time.
  • Switch-in transactions: Treated as purchase transactions and processed based on the fund realization, applying the NAV of the business day when funds are received before the cut-off time.

NFO and Dividend Reinvestment

  • NFO Subscriptions: Units are allotted based on the realization of funds before the NFO closure date.
  • Dividend Reinvestment: Units are allotted at the ex-dividend NAV.
  • The new rule emphasizes that mutual fund transactions (whether through physical or online platforms) will be processed only when funds are realized, ensuring transparency and accuracy in the NAV allocation. This reduces the possibility of discrepancies and promotes better investment planning.

Our View: While knowing these cut-off timings is good, don’t stress too much about them. If you’re investing a large amount, it might make a difference. But for smaller amounts, a day or two here or there usually won’t affect your investment in the long run.
Mutual fund cut-off time, NAV cut-off time for mutual funds, Mutual fund transaction cut-off time, NAV for mutual fund transactions, SIP cut-off time, Liquid fund NAV timing, Redemption cut-off time for mutual funds.

Understanding the cut-off timing for mutual funds is crucial for effective planning. A mutual fund distributor in India or mutual fund advisor in Pune can guide you in aligning your investments with your goals — whether it’s retirement planning, a child education investment plan, or long-term wealth creation strategies. Take the next step with expert financial planning services tailored to your needs.

Sanriya Finvest Logo

How do you select a good Mutual Fund Advisor/Distributor?

Mutual funds are a popular investment choice for diversifying their portfolios and achieving financial goals. However, navigating the complexities of mutual fund investments requires expertise. A mutual fund advisor can play a pivotal role in aligning your investments with your goals, risk tolerance, and financial timeline. Here’s a guide to understanding their role and selecting the right one.

Role of a Mutual Fund Advisor

A mutual fund advisor specialises in helping investors make informed decisions by:

  • Identifying Financial Needs: They assess your financial situation, goals, and timelines to recommend suitable investment strategies.
  • Risk Assessment: Advisors evaluate your risk tolerance and help choose funds aligning with your comfort level and objectives.
  • Portfolio Management: They suggest diversified portfolios tailored to your goals, periodically reviewing and rebalancing to match market conditions.
  • Education: Advisors explain various mutual funds’ benefits, risks, and limitations to ensure informed decisions.
  • Proactive Adjustments: Monitor your investments; they recommend course corrections during market changes or life events.

Key Qualities to Look for in a Mutual Fund Advisor

  1. Experience and Market Knowledge:
    Advisors with substantial experience, especially through market fluctuations, are better equipped to navigate challenges.
  2. Client-Centric Approach:
    A good advisor prioritizes your financial goals over personal commissions, focusing on strategies that benefit you.
  3. Transparency in Communication:
    They should provide clear details about investment plans, associated charges, and potential risks.
  4. Professional Credentials:
    Look for advisors certified by organizations like AMFI (Association of Mutual Funds in India) or holding CFP (Certified Financial Planner) qualifications.
  5. Proactive Engagement:
    An effective advisor provides regular updates, is accessible for queries, and maintains open communication about portfolio performance.
  6. Tailored Asset Allocation:
    A good advisor customizes your portfolio based on your risk profile, financial goals, and investment horizon, ensuring proper diversification.

How to Choose the Best Advisor

  • Referrals and Reviews: Speak to other investors to gauge an advisor’s effectiveness.
  • Evaluate Investment Philosophy: Ensure their approach aligns with your goals and comfort level.
  • Understand Compensation Models: Be wary of advisors who prioritize funds offering higher commissions over client needs.

Conclusion

A mutual fund advisor simplifies the complexities of investing, helping you achieve financial success. Choose an advisor who combines expertise with a client-first approach, ensuring your portfolio aligns with your evolving goals. Regular communication, transparency, and proactive management are hallmarks of an excellent advisor, making them invaluable partners in your wealth-building journey.

Choosing the best mutual fund advisor involves evaluating experience, transparency, and alignment with your financial goals. A trusted mutual fund distributor in Pune or certified financial planner can assist with goal-based investing, from child education plans to retirement planning. Discover tailored financial planning services designed for long-term wealth creation strategies.

Sanriya Finvest Logo

What is the TRI Index? What is the difference between TRI and PRI benchmarks?

In 2018, the Securities and Exchange Board of India (SEBI) introduced a significant change in measuring mutual fund performance. SEBI mandated that mutual funds use the Total Return Index (TRI) instead of the Price Return Index (PRI) to provide a more precise and accurate picture of fund performance.

An index is a tool that measures how a group of stocks performs. For example, Nifty50 tracks the performance of 50 large companies listed on the stock market. The value of an index changes based on the price movements of the companies it includes. Mutual funds use these indexes to compare their performance. If a fund’s return is higher than its index, it is said to have outperformed it.

An index measures the performance of a group of stocks, and mutual funds use these indexes to compare their returns. For example, the Nifty50 tracks the performance of 50 large companies. When comparing a fund’s returns to the Nifty50 index, it has outperformed the index if the fund’s return is higher.

Price Return Index (PRI)

The Price Return Index (PRI) only considers the price change of stocks in the index. It measures how much the stock prices go up or down but ignores any dividends or interest earned from those stocks. For example, if an index rises by 10% but pays out a 2% dividend, PRI would only show the 10% price rise, not the total return, including the dividend.

Total Return Index (TRI)

The Total Return Index (TRI), on the other hand, provides a fuller picture. It considers both the capital appreciation (price changes) and any dividends or interest paid by the companies in the index. This means TRI assumes that dividends or interest are reinvested into the index. So, if an index shows a 10% rise in price and a 2% dividend, the TRI would show a total return of 12%.

Why the Switch from PRI to TRI?

The shift to TRI has dramatically impacted how we understand mutual fund performance. PRI could sometimes be misleading because it ignores dividends, an essential part of an investor’s return. With TRI, investors get a complete picture of their earnings, including both price changes and dividends.

For example, a fund might show a return of 7%, but if the PRI return is 6.5%, it could seem like the fund has outperformed the benchmark. But when you add dividends, the benchmark’s return might be 8%, meaning the fund didn’t perform as well as it seemed.

Key Differences Between PRI and TRI

Feature PRI (Price Return Index) TRI (Total Return Index)
What it tracks Only price changes Price changes + dividends/interest
Accuracy Less accurate More accurate
Use Used in older methods Provides better transparency

 Conclusion

The switch to TRI ensures investors get a more realistic and transparent view of mutual fund performance. By including price changes and dividends, TRI clarifies how well an investment is performing, helping investors make more informed decisions about their investments.

Understanding the TRI vs PRI benchmark difference is key for evaluating mutual fund performance. A mutual fund distributor in India or certified financial planner can help investors use such benchmarks to inform goal-based investing, whether it’s retirement planning, a child education investment plan, or broader wealth creation strategies through tailored financial planning services.

Mutual Fund investments are subject to market risks. Always read the scheme-related documents carefully before investing.

Sanriya Finvest Logo